What is Tabletop Tracker?
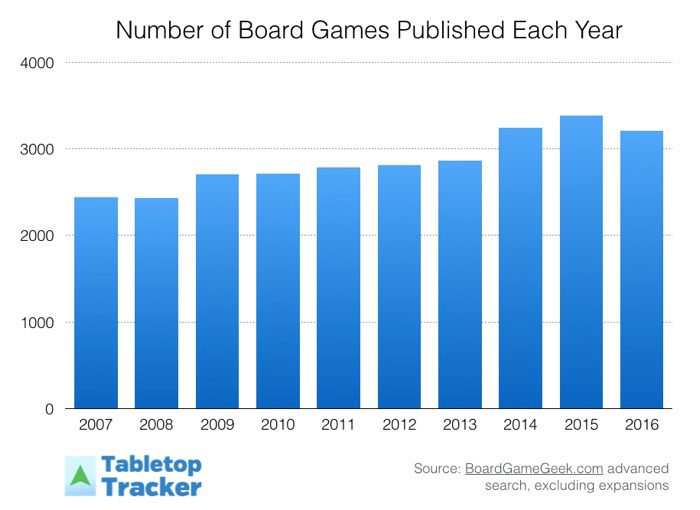
3,206 board games were published just last year, according to BoardGameGeek. Over the last decade, over 28,000 games have been released.

Not only are more games being published each year, the quality of games continues to rise. If you’re a board game enthusiast with limited time or money, it can be overwhelming knowing which new games to look into.
I built Tabletop Tracker to solve that issue. Tabletop Tracker helps you track which new board games deserve your attention among the thousands of games published each year.
It does this by pinpointing which games are most quickly moving up the BoardGameGeek rankings.
About BoardGameGeek Rankings
If you’re new to the board gaming hobby, BoardGameGeek is the premier website about board games. It’s a wiki and a social network rolled into one. Users can create pages about board games as they are released. Then board games can be rated by the community.
Board games with at least 30 ratings are eligible to be ranked. There are currently 13,248 ranked games on BoardGameGeek ranging from the number 1 ranked board game ( Pandemic Legacy: Season 1 ) and the lowest ranked game ( Tic-Tac-Toe ).
Rankings are based on a game’s Geek Rating. This is the average of a game’s user ratings, weighted for the total number of its ratings. That means a game with the same average user rating (but with more total ratings) is more likely to be ranked higher. For context, Pandemic Legacy: Season 1 has a Geek Rating of 8.5/10, and Tic-Tac-Toe has a Geek Rating of 3.3/10.
How Tabletop Tracker Helps
![]()
BoardGameGeek has a excellent rating system, but it doesn’t provide context on how quickly a game is rising in the rankings.
Tabletop Tracker takes a snapshot of all ranked games each day so it can calculate the change in a game’s rankings over time.
This allows you to see which new board games are shooting up in the rankings based on adoption from the board gaming community.
If you’re interested in only exceptional games that are moving up in the rankings, use the Top 1,000 chart. Since there are currently 13,248 ranked games, this means this chart is filtering to only the games ranked in the top 7.5% of all ranked games.
Top 10 Chart
![]()
Besides rankings charts, I also included a line chart showing the top 10 games over time to give some context.
Games represented by grey lines are games that have dropped out of the current top 10. You can hover over a line to see which game was ranked among the top 10 going back to 2009.
What is interesting is how much more volatility you see in recent years compared to the relative stability in the top 10 in earlier years.
This chart is being drawn using the Google Charts API and I checked the Wayback Machine for historical data.
The Hotness
![]()
This section of Tabletop Tracker pulls from the BoardGameGeek Hotness list. BoardGameGeek calculates which games are getting the most views on their site. The data in this view is coming from the BoardGameGeek API.
The games on this list are often tied to games people are most excited about. Often these are games that are highly anticipated but not yet available.
Tips on Using Tabletop Tracker
- Toggle between Day and Week in the ranking charts to change the date range.
- In The Hotness chart, hover over an image to learn more details about a game.
- Click any game title or image to be sent to its BoardGameGeek entry.
- Hover over a chart title to learn more about that specific chart.
Similar Tools
If you’re on BoardGameGeek, Michael Alexander (beefsack), has been posting the biggest BGG Climbers each week based on ranking changes. You can subscribe to it directly from within BoardGameGeek.
Sharon Khan (sa266) is also tracking which games are getting the most plays each month.
Add a comment if I’m missing a great resource.
How was Tabletop Tracker built?
This was a project I built after 3 months in Nashville Software School. (I graduate and will be looking for work in April, 2017 by the way). Here are the slides I put together when presenting to my fellow students.
Geeky Technical Details
The Tabletop Tracker crawler wakes up daily and records the current position of all ranked games. Then it does all its calculations in Node and pushes up all the data the website will need for the day.
Since data is cached daily, once a visitor visits TabletopTracker.com, all data needed to draw the charts can be pulled down with one database call. The website is deployed on Heroku and I’m using Google Firebase to store data.
During the holidays the BoardGameGeek API wasn’t returning data for a few days. Since this happened a few days before my project was due, I was a little on edge. The silver lining is that it taught me plan out what might break when planning future projects.
I also refactored Tabletop Tracker to be less reliant on the BoardGameGeek API. If it goes down for a period of time, my site still loads and shows all rankings movement charts.
If you’re interested in seeing the code, feel free to check it out on Github.
Help Me Make it Better
Since I’m in love with both board games and code, I’ll be continuing to maintain this project. If you want to know when I add new charts and features, join the Tabletop Tracker email list.
You can also submit bugs or feature requests in Github or in the comments below.
Happy board game tracking!
What do you think about Tabletop Tracker – Track the hottest board game rankings? Give us your opinions in the comments below!


